 Typimo
Add editable charts to your documents
Charts in Typimo Docs are real, editable objects. Insert one, type your data, and adjust the look — the chart updates as you go and exports with your document.
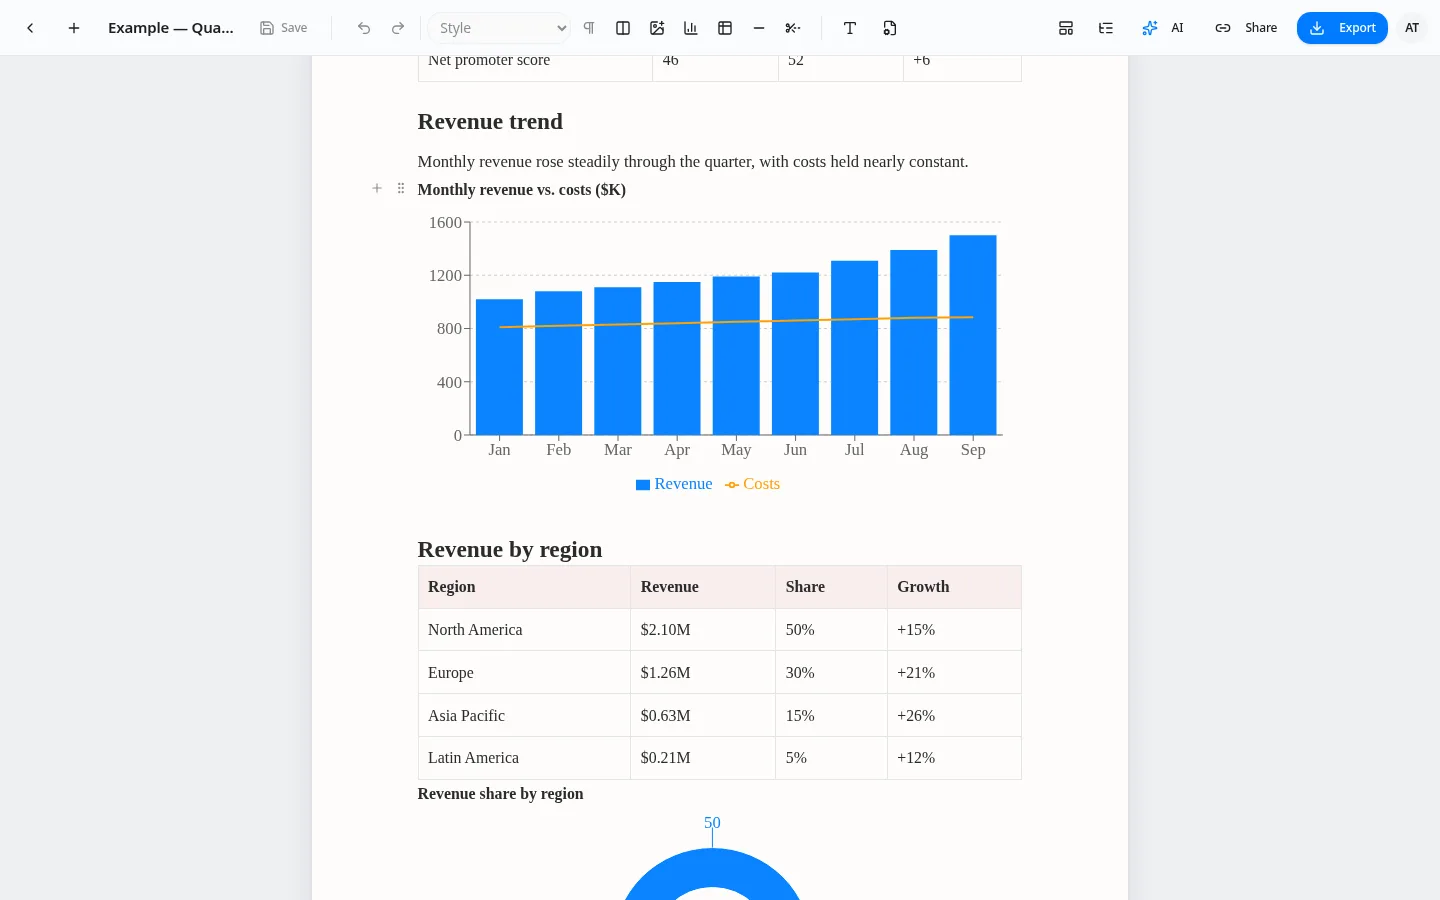
Chart types and options
Choose bar, column, line, area, pie and combined charts. Turn legends, tooltips and grids on or off, label axes, add units and set the height.
Three ways to edit
- Setup — pick the chart type, series and axes visually.
- Data — edit values in a simple table.
- JSON — paste or tweak the chart definition directly, or share it with AI.